43639 Elm Ave
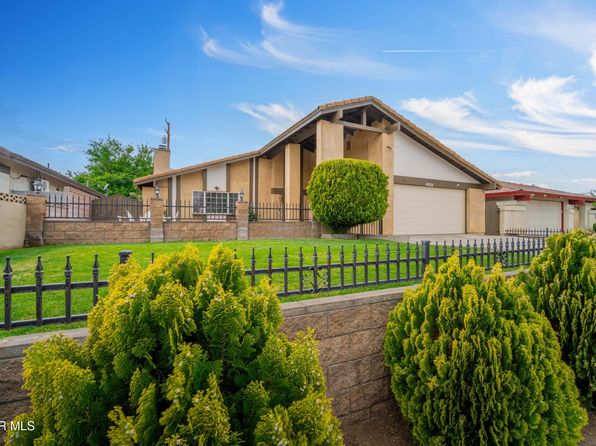
More Than Just a Property
We believe a home extends beyond its walls. That's why we help you explore the pulse of the community—from top-rated schools to essential emergency services. Your safety, well-being, and connection to the neighborhood matter to us.
Nearby Schools
Educational options and performance ratings in the area.
Sierra Elementary School
Endeavour Middle School
Antelope Valley High School
Property Overview
A stunning investment opportunity in a prime location. This property features modern amenities, spacious living areas, and strong rental potential.
Features & Amenities
Haven AI Verdict
Data provided by Haven AI. Disclaimer
Haven AI
This property presents a challenging proposition for the conservative investor. While the 5.95% gross yield is respectable for California, the negative monthly cash flow of -$45.64 is a primary concern. For a conservative analyst, an investment that requires monthly out-of-pocket contributions is speculative, as it relies entirely on the 4% projected appreciation to generate a net return. Lancaster offers a lower entry point than coastal Los Angeles, but it typically sees higher maintenance and utility costs due to the high-desert climate. Without a significant down payment increase or a reduction in price, this asset fails to provide the necessary safety margin required for a stable income-producing portfolio.
- • High rental yield relative to the broader California market
- • 3-bedroom, 3-bathroom configuration is highly desirable for families
- • Lower price point for a single-family home in the Los Angeles County area
- • Strong square footage at 1,793 sqft supports competitive market rents
- • Negative monthly cash flow indicates the property is not self-sustaining at current debt levels
- • Dependence on appreciation rather than income for total return
- • Lancaster historically experiences higher volatility and longer commute-based vacancy risks
- • Conservative analysis suggests high desert utility and maintenance costs may further erode margins
10-Year Price Projection
Price & Tax History
Price History
| Date | Event | Price | Price/sqft |
|---|---|---|---|
| 2026-04-29 | Listed for sale | $450,000 | $251 |
| 2026-01-01 | Listing removed | $479,000 | $267 |
| 2025-12-05 | Price change | $479,000 | $267 |
| 2025-09-01 | Price change | $489,000 | $273 |
| 2025-08-02 | Listed for sale | $500,000 | $279 |
| 2003-07-24 | Sold | $180,000 | $100 |
Tax History
| Year | Property Tax | Tax Assessment |
|---|---|---|
| 2025 | $4,643.34 | $255,898 |
| 2024 | $4,422.73 | $250,882 |
| 2023 | $4,330.16 | $245,963 |
| 2022 | $4,119.88 | $241,141 |
| 2021 | $3,719.03 | $236,414 |
| 2020 | $3,676.52 | $233,991 |
| 2019 | $3,676.52 | $229,404 |
| 2018 | $3,547.6 | $224,907 |
| 2017 | $3,547.6 | $190,800 |
| 2016 | $3,150.02 | $170,000 |
| 2015 | $2,814.72 | $170,000 |
| 2014 | $2,834.27 | $170,000 |
| 2012 | $0 | $119,000 |
| 2011 | $0 | $119,000 |
| 2010 | $0 | $119,000 |
| 2009 | $0 | $138,000 |
| 2008 | $0 | $194,835 |
| 2007 | $0 | $191,015 |
| 2006 | $0 | $187,271 |
| 2005 | $0 | $187,271 |
| 2004 | $0 | $180,000 |
| 2003 | $0 | $139,800 |
| 2002 | $0 | $114,700 |
| 2000 | $0 | $108,000 |

Investment Numbers & Operating Model
Standardized cash flow underwriting modeled with state tax schedules, regional insurance hazard risk, and disciplined operating reserves.
Multi-factor yield grade
NOI: $21,927/yr
On $103,500 invested
Negative debt coverage
Equity + cumulative cash
Monthly Cash Flow Breakdown
Similar Properties Nearby
Explore other investment opportunities in Lancaster.