10061 Van Ruiten St
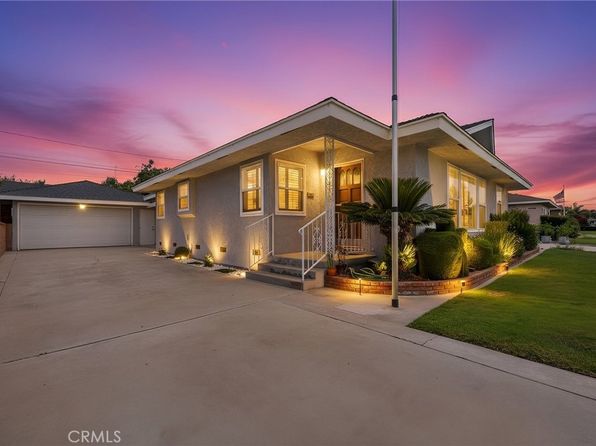
More Than Just a Property
We believe a home extends beyond its walls. That's why we help you explore the pulse of the community—from top-rated schools to essential emergency services. Your safety, well-being, and connection to the neighborhood matter to us.
Nearby Schools
Educational options and performance ratings in the area.
Frank E. Woodruff Elementary School
Bellflower High School
Property Overview
A stunning investment opportunity in a prime location. This property features modern amenities, spacious living areas, and strong rental potential.
Features & Amenities
Haven AI Verdict
Data provided by Haven AI. Disclaimer
Haven AI
10061 Van Ruiten St presents a challenging profile for conservative investors. While Bellflower is a stable submarket with consistent demand for 3-bedroom single-family homes, the financial fundamentals are currently misaligned. A monthly cash flow deficit of -$933.76 creates a significant negative carry situation, requiring the investor to subsidize the asset by over $11,000 annually. The rental yield of 4.67% is insufficient to cover debt service and operating expenses in the current interest rate environment. Relying primarily on the 4% projected appreciation to achieve a positive return is speculative and violates conservative investment principles. Without a significantly larger down payment to neutralize the cash burn, this property is a high-risk drain on liquidity.
- • High demand for 3-bedroom, 2-bathroom configurations in the Los Angeles metro area
- • Consistent 4% historical appreciation rate for the Bellflower submarket
- • Single-family residential asset class offers better long-term tenant stability
- • Substantial negative monthly cash flow of -$933.76 indicates poor debt-coverage
- • Cap rate and rental yield are too low to offset current financing costs
- • Investment success is overly dependent on speculative future appreciation rather than current income
- • High barrier to entry with a $799,999 price point for a negative-yielding asset
10-Year Price Projection
Price & Tax History
Price History
| Date | Event | Price | Price/sqft |
|---|---|---|---|
| 2026-04-30 | Listed for sale | $799,999 | $476 |
Tax History
| Year | Property Tax | Tax Assessment |
|---|---|---|
| 2025 | $4,153.74 | $312,028 |
| 2024 | $3,965.88 | $305,911 |
| 2023 | $3,813.66 | $299,913 |
| 2022 | $3,743.35 | $294,033 |
| 2021 | $3,661.62 | $288,269 |
| 2020 | $3,628.56 | $285,314 |
| 2019 | $3,628.56 | $279,720 |
| 2018 | $3,388.25 | $274,236 |
| 2017 | $3,388.25 | $268,860 |
| 2016 | $3,318.19 | $263,589 |
| 2015 | $3,238.34 | $259,630 |
| 2014 | $3,130.66 | $254,545 |
| 2012 | $0 | $248,427 |
| 2011 | $0 | $243,557 |
| 2010 | $0 | $241,738 |
| 2009 | $0 | $242,314 |
| 2008 | $0 | $237,564 |
| 2007 | $0 | $232,907 |
| 2006 | $0 | $228,341 |
| 2005 | $0 | $228,341 |
| 2004 | $0 | $219,476 |
| 2003 | $0 | $215,455 |
| 2002 | $0 | $211,231 |
| 2000 | $0 | $188,300 |

Investment Numbers & Operating Model
Standardized cash flow underwriting modeled with state tax schedules, regional insurance hazard risk, and disciplined operating reserves.
Multi-factor yield grade
NOI: $29,034/yr
On $184,000 invested
Negative debt coverage
Equity + cumulative cash
Monthly Cash Flow Breakdown
Similar Properties Nearby
Explore other investment opportunities in Bellflower.