41 Chestnut St
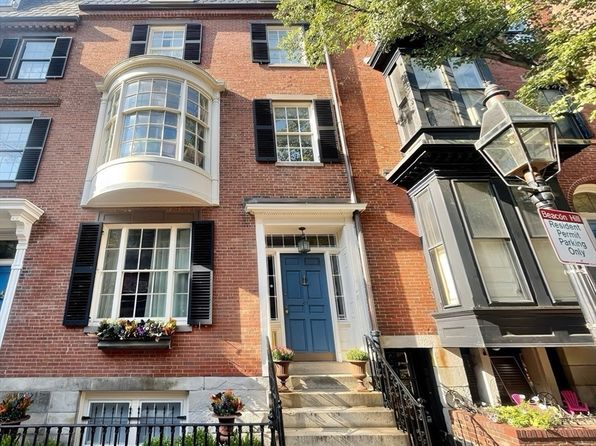
More Than Just a Property
We believe a home extends beyond its walls. That's why we help you explore the pulse of the community—from top-rated schools to essential emergency services. Your safety, well-being, and connection to the neighborhood matter to us.
Nearby Schools
Educational options and performance ratings in the area.
Josiah Quincy Elementary School
Quincy Upper School
Boston Adult Academy
Property Overview
A stunning investment opportunity in a prime location. This property features modern amenities, spacious living areas, and strong rental potential.
Features & Amenities
Haven AI Verdict
Data provided by Haven AI. Disclaimer
Haven AI
41 Chestnut Street is a high-profile luxury asset in Boston's prestigious Beacon Hill, but from a conservative investment standpoint, the numbers are challenging. With a monthly rental yield of approximately 0.20%, the gross annual income of roughly $146,880 fails to provide a meaningful cushion against the high carrying costs associated with a $5.99M property. After accounting for Boston property taxes, insurance, and the substantial maintenance requirements of a historic 3,849 sqft structure, investors should expect negative net cash flow. While a 4% appreciation rate provides long-term equity upside, the lack of immediate yield makes this property a wealth-preservation vehicle rather than a viable income-generating investment.
- • Premier Beacon Hill location with extreme scarcity and high prestige
- • Consistent 4% annual appreciation forecast typical of core Boston markets
- • Substantial 3,849 sqft living area for a historic urban property
- • High-end tenant demographic reduces credit risk
- • Extremely low 0.20% rental yield results in poor debt service coverage
- • Likely negative cash flow after accounting for taxes, insurance, and maintenance
- • High entry price point limits the pool of future buyers
- • Historical masonry and age present significant CAPEX risks
10-Year Price Projection
Price & Tax History
Price History
| Date | Event | Price | Price/sqft |
|---|---|---|---|
| 2026-07-23 | Sold | $5,600,000 | $1,455 |
| 2026-06-19 | Pending sale | $5,699,000 | $1,481 |
| 2026-06-19 | Contingent | $5,699,000 | $1,481 |
| 2026-06-02 | Price change | $5,699,000 | $1,481 |
| 2025-09-11 | Price change | $5,995,000 | $1,558 |
| 2025-03-20 | Listed for sale | $6,250,000 | $1,624 |
| 2015-07-29 | Sold | $3,877,500 | $1,007 |
| 2015-06-16 | Pending sale | $4,095,000 | $1,064 |
| 2015-05-13 | Price change | $4,095,000 | $1,064 |
| 2015-02-24 | Listed for sale | $4,295,000 | $1,116 |
| 2015-02-20 | Pending sale | $4,295,000 | $1,116 |
| 2014-10-07 | Price change | $4,295,000 | $1,116 |
| 2014-07-14 | Listed for sale | $4,495,000 | $1,168 |
| 2003-01-21 | Sold | $2,800,000 | $727 |
| 1991-07-08 | Sold | $123,976 | $32 |
| 1990-07-23 | Sold | $1,100,000 | $286 |
Tax History
| Year | Property Tax | Tax Assessment |
|---|---|---|
| 2025 | $57,124 | $4,933,000 |
| 2024 | $52,022 | $4,772,700 |
| 2023 | $51,259 | $4,772,700 |
| 2022 | $49,454 | $4,545,400 |
| 2021 | $47,549 | $4,456,300 |
| 2020 | $47,025 | $4,453,100 |
| 2019 | $44,709 | $4,241,800 |
| 2018 | $41,562 | $3,965,800 |
| 2017 | $9,987.18 | $3,777,000 |
| 2016 | $39,949 | $3,631,700 |
| 2015 | $40,604 | $3,352,900 |
| 2014 | $42,879 | $3,408,500 |
| 2013 | $41,470 | $3,156,000 |
| 2012 | $38,143 | $2,925,100 |
| 2011 | $36,456 | $2,850,330 |
| 2010 | $31,946 | $2,689,050 |
| 2009 | $29,524 | $2,777,400 |
| 2008 | $30,454 | $2,776,100 |
| 2007 | $31,489 | $2,865,200 |

Investment Numbers & Operating Model
Standardized cash flow underwriting modeled with state tax schedules, regional insurance hazard risk, and disciplined operating reserves.
Multi-factor yield grade
NOI: $-12,770/yr
On $1,378,850 invested
Negative debt coverage
Equity + cumulative cash
Monthly Cash Flow Breakdown
Similar Properties Nearby
Explore other investment opportunities in Boston.